- February 20, 2023
A platform with insights to connect what’s human with what’s built at the Phenix
Since designing our Montreal office and sustainable design laboratory of the Phenix around NET POSITIVE™ strategies, we’ve been looking for deeper ways to measure its performance.
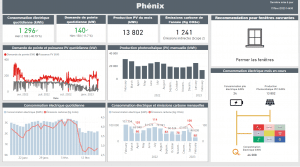
That’s why we’ve created a new performance dashboard to track its activity and energy efficiency. Mostly developed internally with partners such as the building science firm Martin Roy et Associés and built on Microsoft’s Power BI platform, the dashboard reveals insights into the office’ renewable energy production and general consumption in real time.
Using a customized algorithm and visual interface, the dashboard can give us a detailed picture of our energy efficiency levels and carbon emissions.
A showcase of sustainable strategies to drive change and action
With tools like this, people can be connected more deeply with the buildings we design for them.
At Lemay, all employees have access to the data and the story it tells about how the building is performing, giving us a concrete visual representation of the building’s inner workings and the impact of our energy production and consumption.
Take the data around the efficiency of the Phenix’s solar panels, for example: Its table in the dashboard shows how our photovoltaic panels—the second largest installation of its kind in Montreal—are performing through their energy collection levels. Fun fact: Their highest energy collection happened in February 2022—while cold, it was definitely sunny!
In addition to this, the dashboard’s data can also inform recommendations around whether or not office windows should be open or closed to take advantage of the Phenix’s passive cooling or heating systems. To do this, the system analyzes the Phenix’s temperatures and humidity level performance twice a day in the morning and afternoon, both inside and outside, to make these recommendations.
Connecting buildings, technology and users
The technical side of energy efficiency can be difficult to understand at times. With integrated technologies like our dashboard, the language around sustainable actions is transformed into both hard data collection as well as simple imagery and clear recommendations, so building users like our own can improve their well-being as well as their building’s performance.
Get a complete picture of the Phenix’s energy efficiency and carbon emission reductions with our 2022 NET POSITIVE report here.